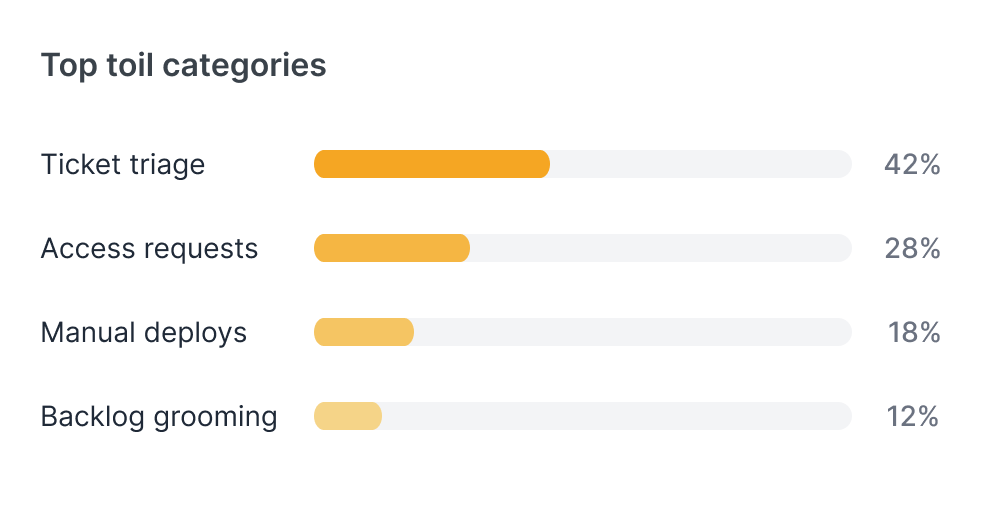
Toil Detection
Surfaces repetitive process work that quietly consumes capacity without showing up anywhere.
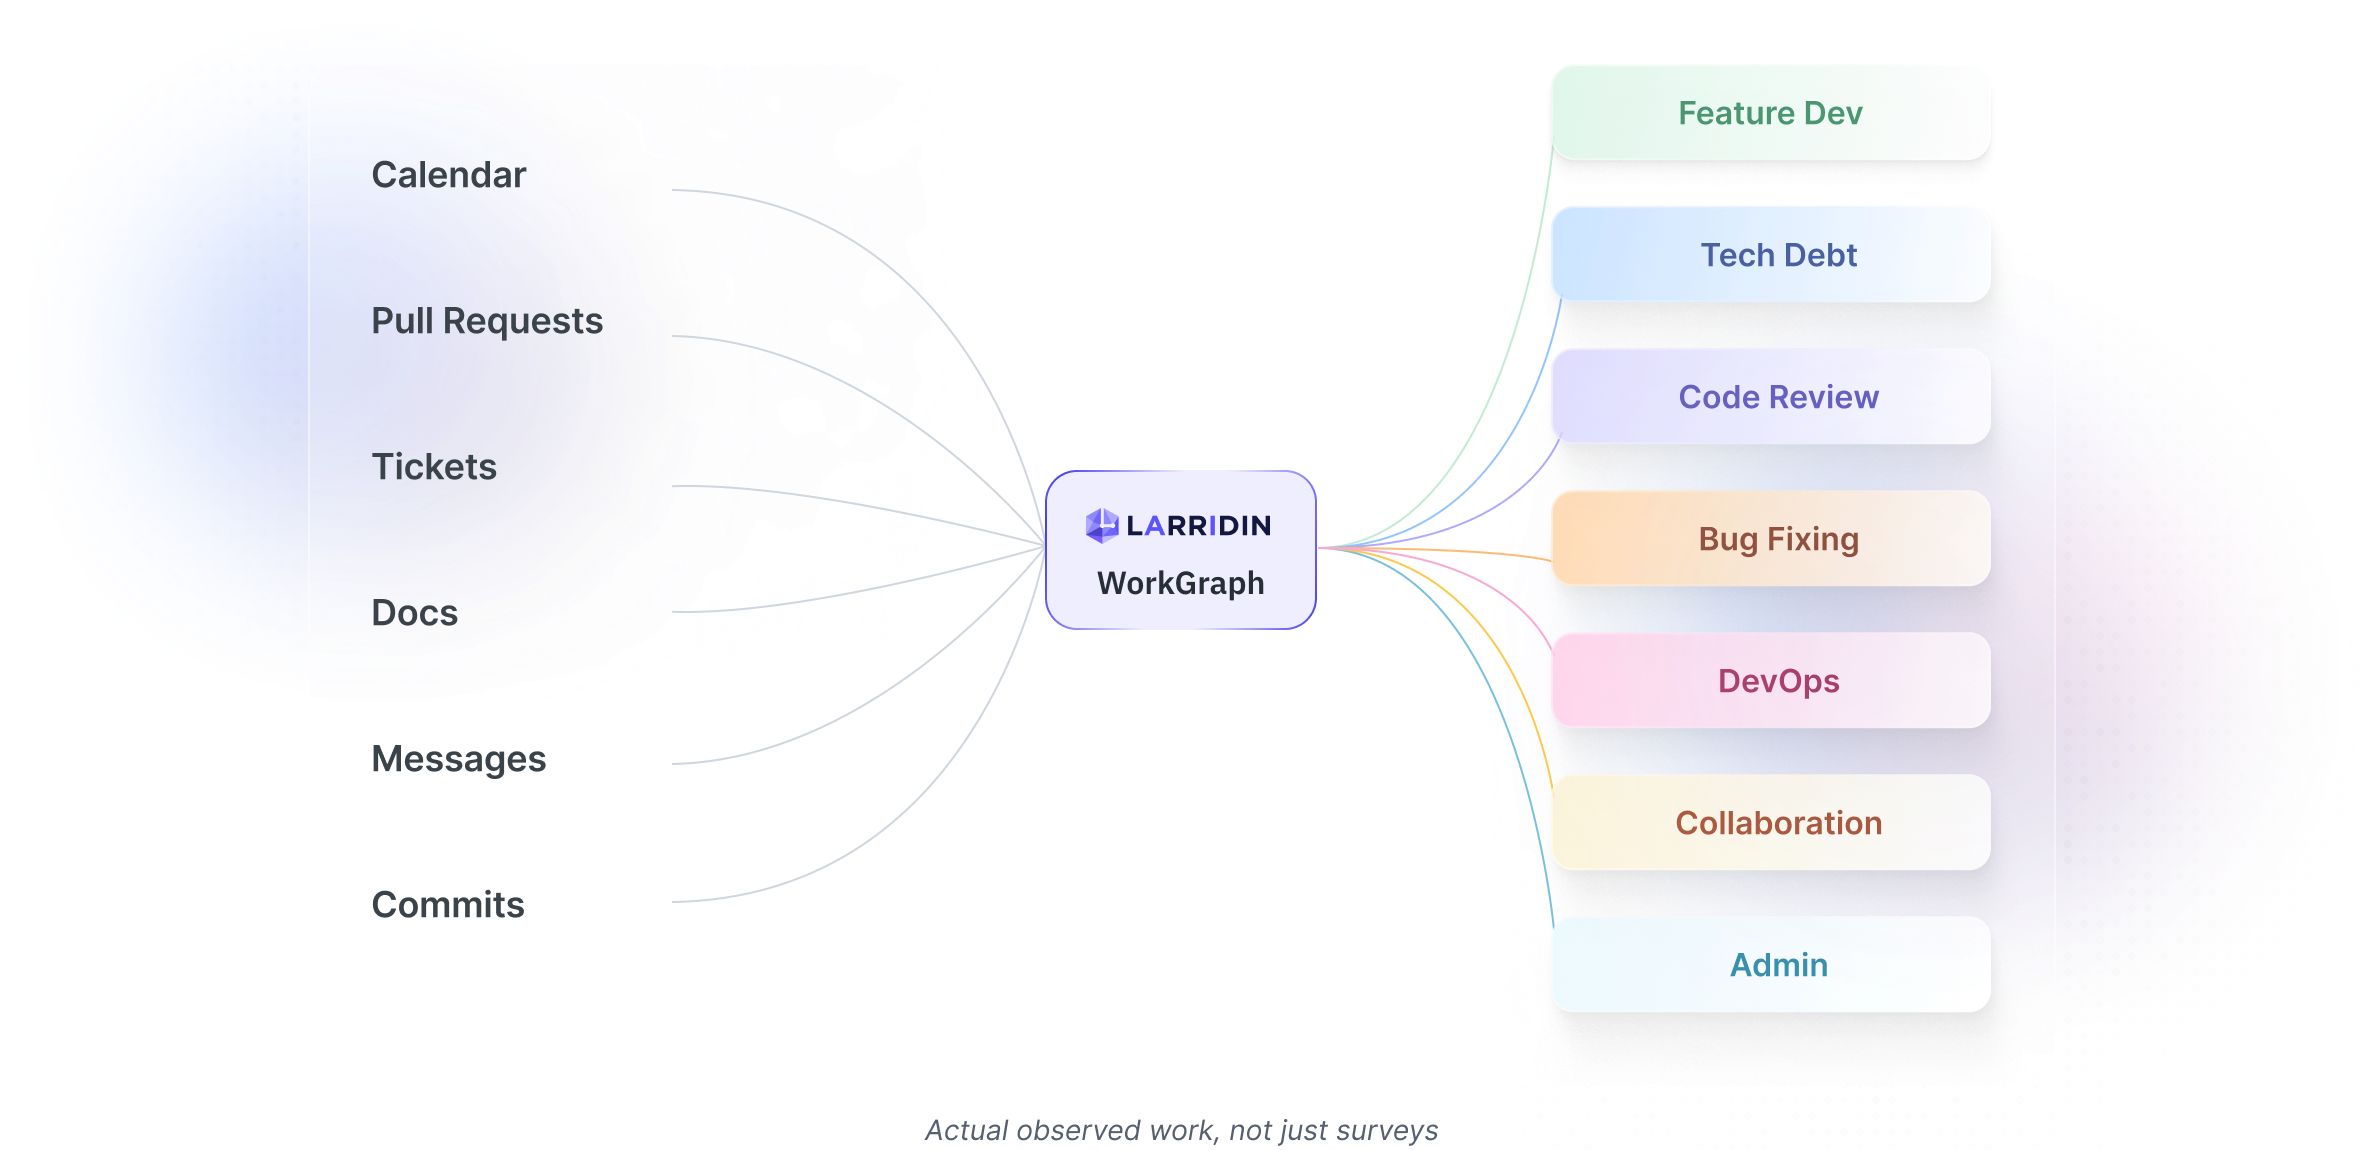
WorkGraph
Larridin maps how engineering work flows across your org, finds the blockers and friction that affect productivity, and shows you exactly what to fix.
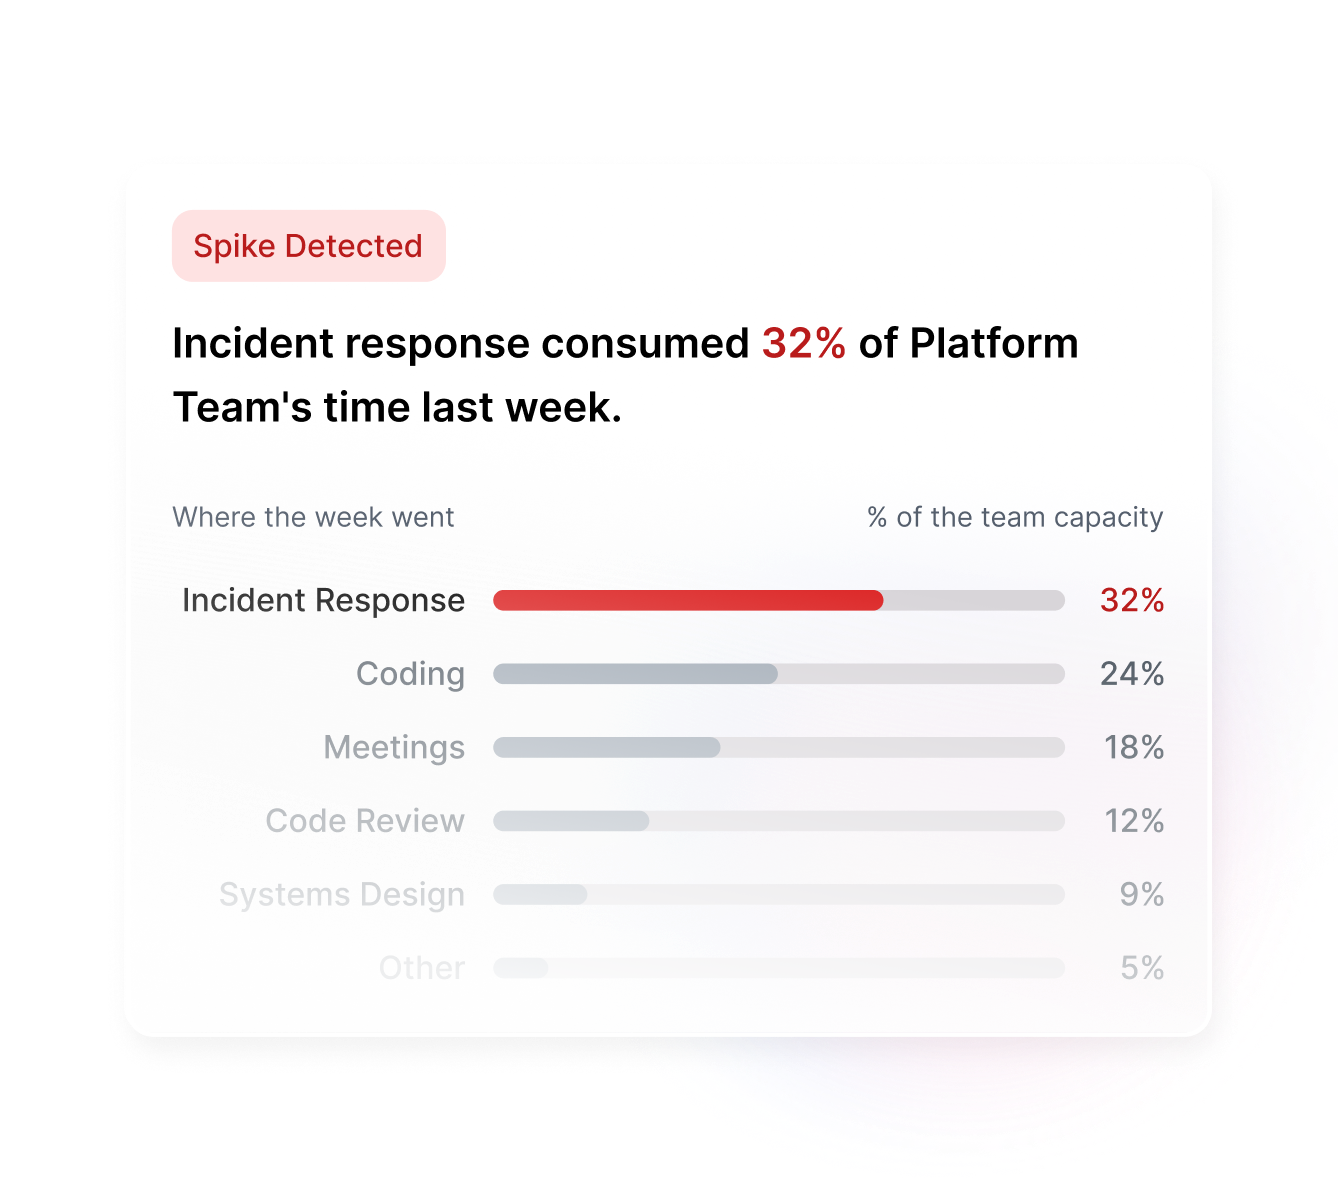
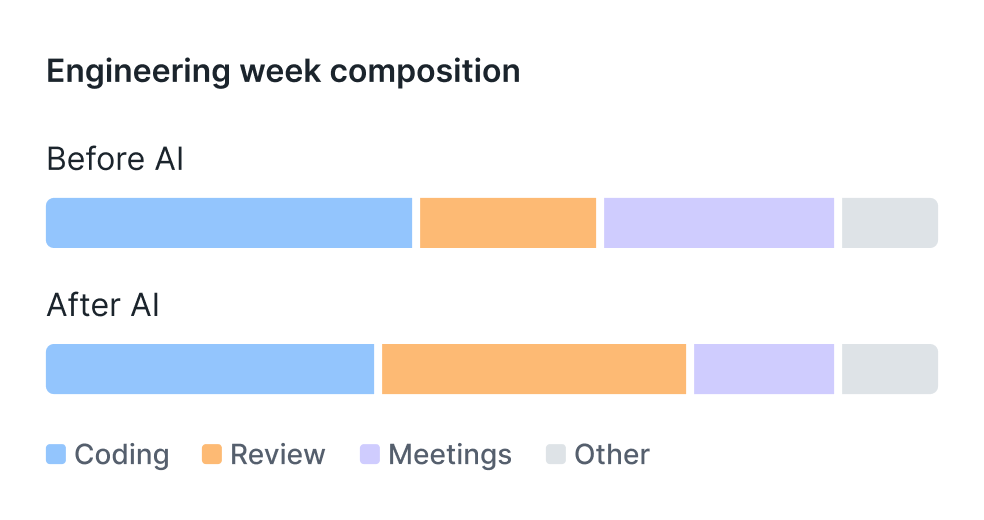
THE REAL ENGINEERING WEEK
Engineering work rarely looks the way you expect it to. Most of the gap is invisible, and most of it is where productivity gets lost.
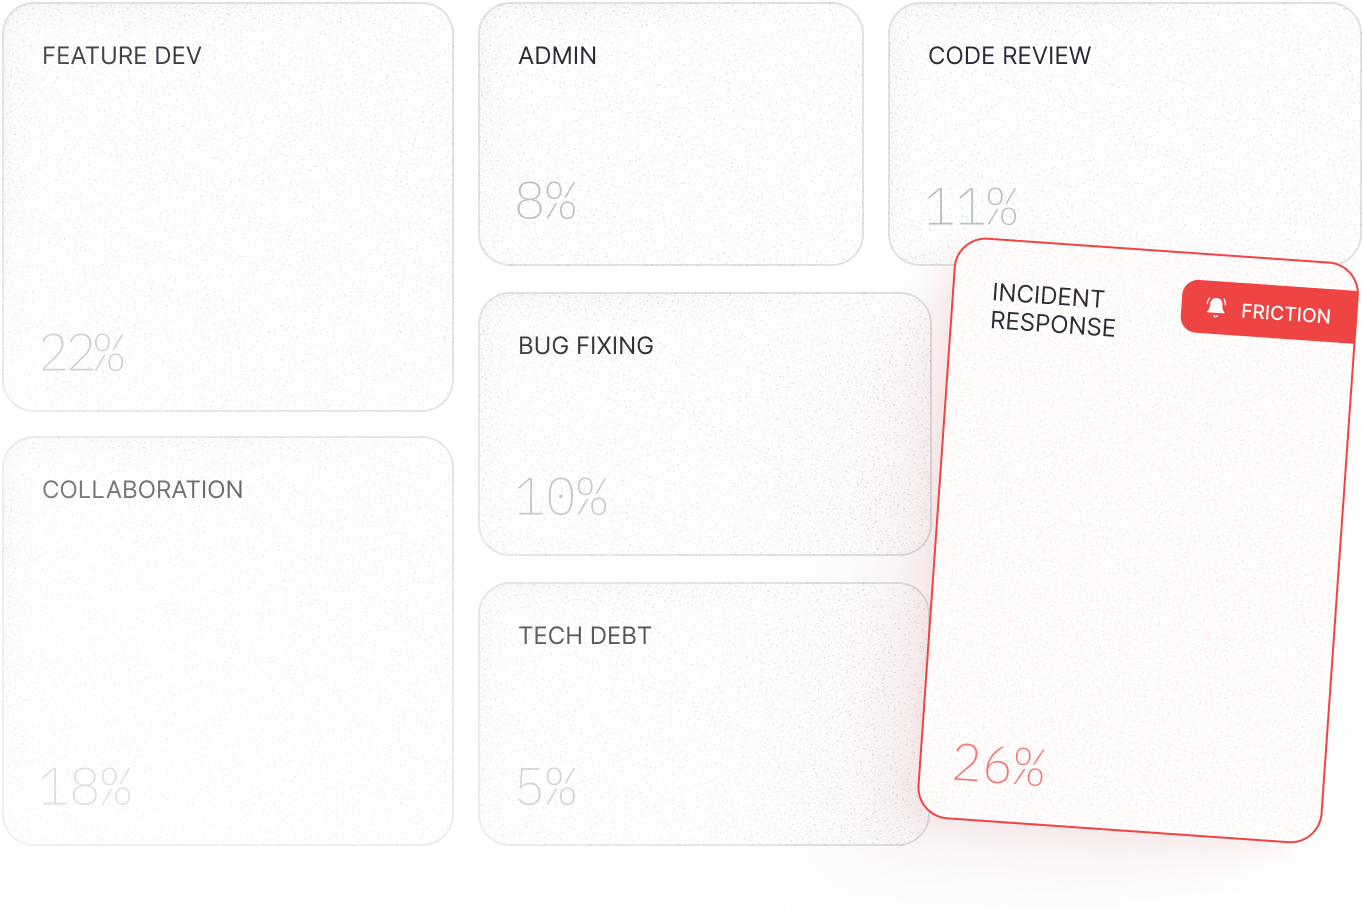
WHAT YOU PLAN
WHAT HAPPENS
THE PROBLEM
Process overhead creeps up silently. Incidents spill into sprint work. Together, they’re the reason your best engineers feel stuck and the reason quarterly output keeps slipping despite everyone working harder.
WorkGraph makes these patterns visible and actionable.
THE SOLUTION
WorkGraph observes and classifies how your teams spend their time across six core categories. Granular enough to spot the real problems. Clear enough to act on them.
BEYOND THE STANDARD VIEW
The work that slows your team rarely shows up in dashboards. These metrics do:
Surfaces repetitive process work that quietly consumes capacity without showing up anywhere.
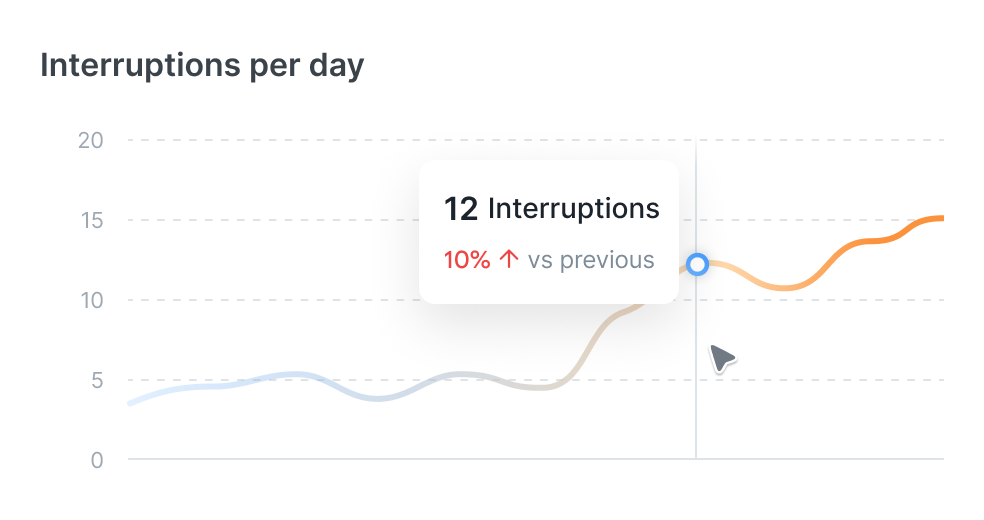
Shows whether AI tools are improving delivery or just moving the bottleneck downstream.
Measures real predictors of output quality: context switches, interruption frequency, and uninterrupted blocks.
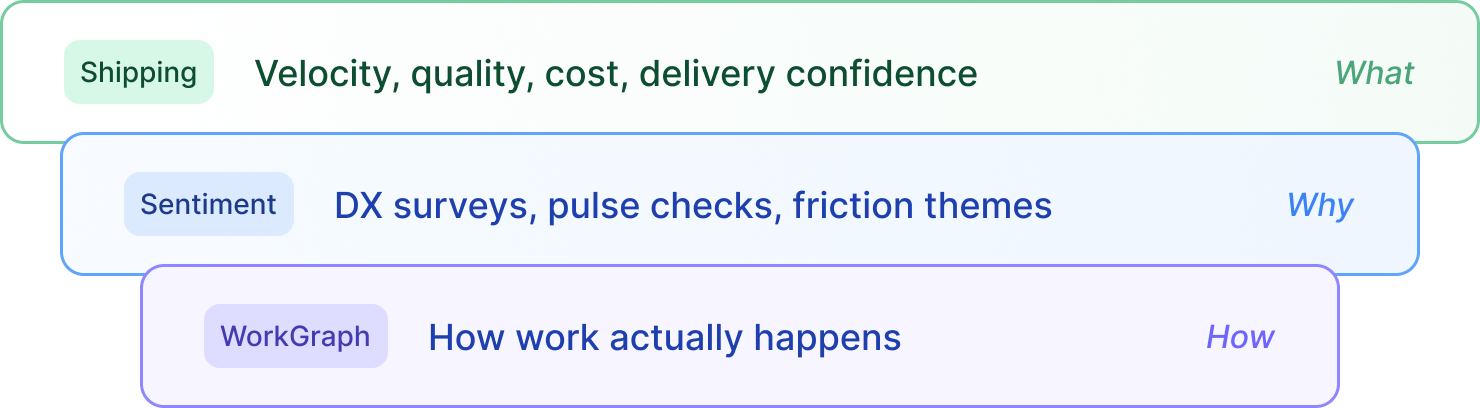
PART OF 360° DEVELOPER INTELLIGENCE
Shipping metrics tell you what. Sentiment tells you why. WorkGraph tells you how and where to act.
Start with a discovery call. We’ll show you how Larridin gives you complete visibility into your AI transformation in minutes, not months.